LA Weather: January 2012 (NOAA)

Station: Los Angeles Downtown USC

Daily Summary (Core Dataset)

Date Max °F Min °F Avg °F Dep (°F) Precip (in) Weather Avg Wind (mph) Peak Gust (mph)
Jan 1824664+6.40.00BR, HZ0.58
Jan 2804563+5.40.00FG, BR0.39
Jan 3795065+7.40.000.610
Jan 486*5571+13.30.001.09
Jan 5825569+11.30.001.310
Jan 6734961+3.20.000.08
Jan 7644957−0.80.00FG, BR, HZ1.612
Jan 8694457−0.80.00BR, HZ0.412
Jan 9744660+2.10.000.712
Jan 10704759+1.10.00BR0.612
Jan 11674757−0.90.00BR0.48
Jan 12755163+5.00.000.28
Jan 13764460+2.00.000.99
Jan 146947580.00.000.39
Jan 15634655−3.0T0.59
Jan 16595055−3.10.00HZ1.112
Jan 17594351−7.10.000.813
Jan 18644354−4.10.000.812
Jan 196442*53−5.10.00HZ0.312
Jan 20624956−2.10.00BR, HZ0.410
Jan 21634956−2.10.68RA, BR, HZ2.721
Jan 22624755−3.20.000.512
Jan 23544751−7.20.62RA, BR2.317
Jan 24684456−2.20.00BR0.610
Jan 25794864+5.80.000.09
Jan 26795065+6.80.000.812
Jan 27785366+7.80.000.79
Jan 28764561+2.80.000.08
Jan 29774762+3.70.000.810
Jan 30694658−0.30.000.712
Jan 31665058−0.30.00BR1.216

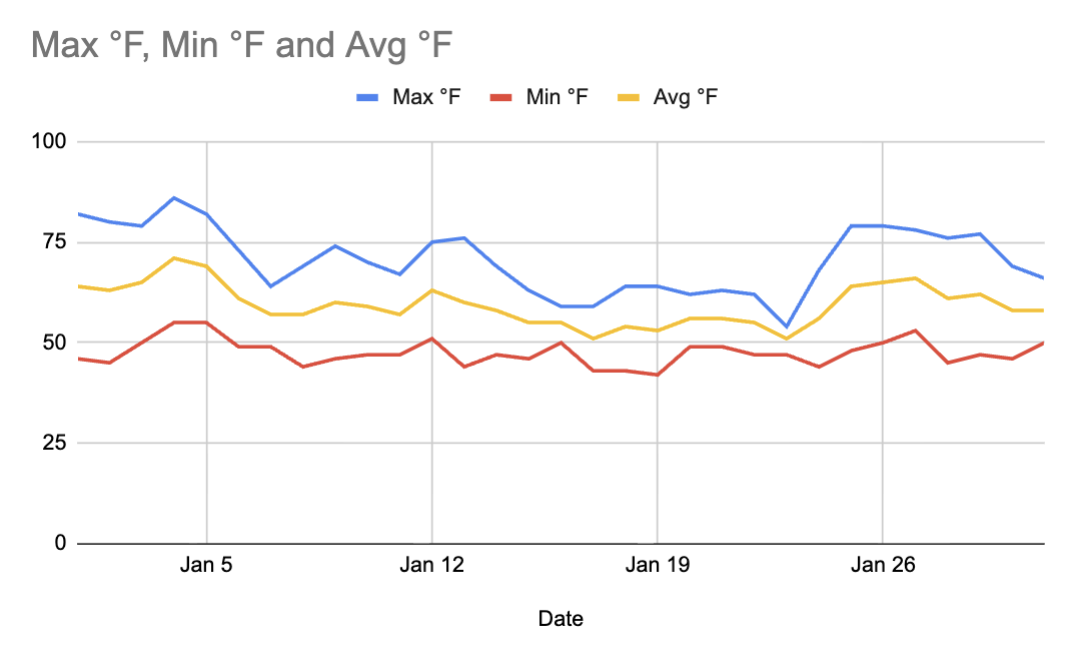
Temperatures fluctuated throughout January, for two major warm periods: Jan 4-5 and Jan 25-27, where avg temperatures rose over 10F above. Jan 16-23 contrastly drops to low 50s. SoCal weather is irregular

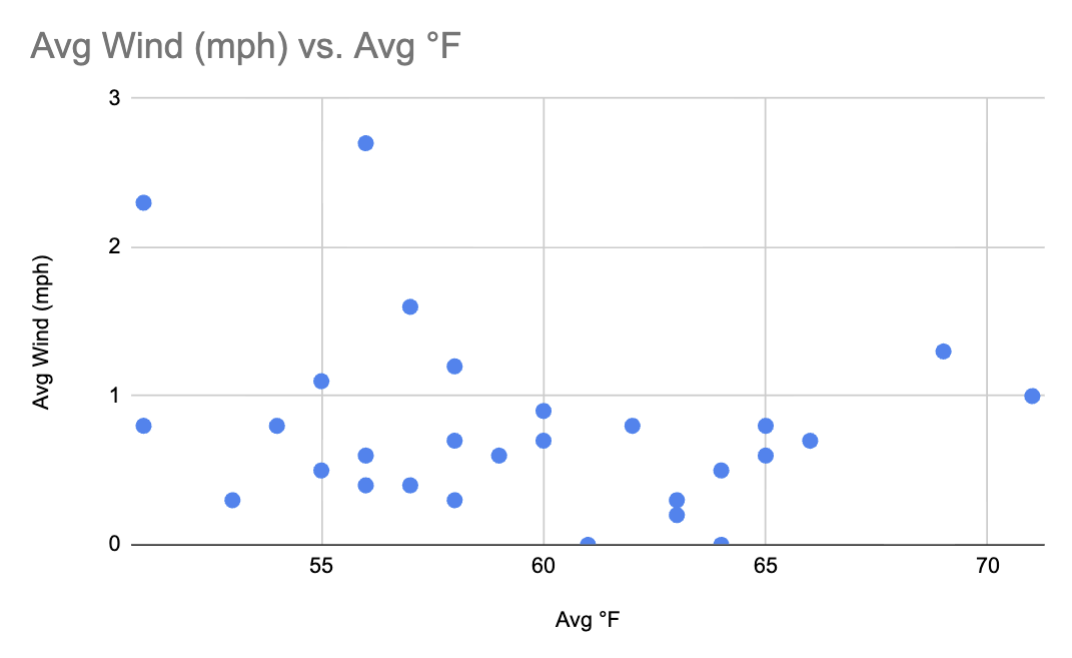
There's a direct inverse relationship between temperature and wind speed. The cooler the day, the windier, and the hotter the day the less windy. However, these findings are not that extreme, and outliers may throw off the data.

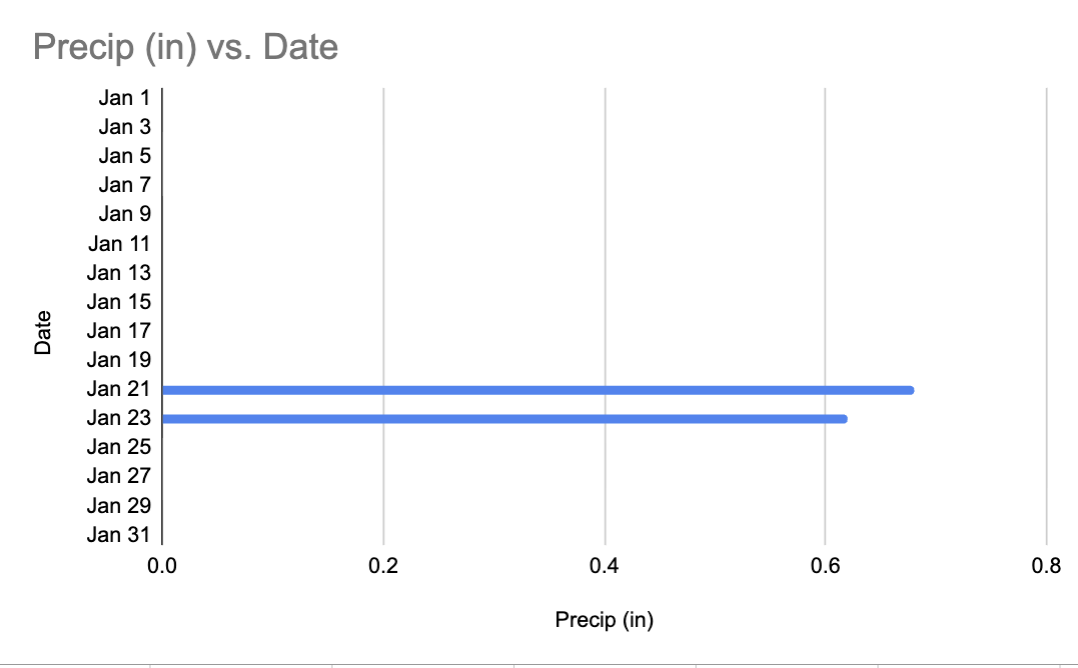
This chart reallllllly emphasizes Southern California's dryness spell, expect for jan 21 and jan 23. Communicates the rarity of rainfall, and how much it pours when there is.